Feature Line Detection in Surface Modeling

A Structured Guide for CAE Engineers and Software Engineers

Feature lines are essential structural indicators that define surface organization. These lines mark abrupt transitions, highlight curvature patterns, and expose the underlying framework guiding segmentation and meshing protocols. For CAE engineers, feature lines inform element alignment, delineate requisite refinement zones, and determine boundary layer conformity to geometric attributes. For software engineers developing meshing solutions, feature lines enable the conversion of raw surface data into algorithms that consistently generate stable, high-quality meshes.

Failure to identify feature lines accurately can lead to unpredictable meshing results, including misplaced refinements, inappropriate segmentation, and solver inefficiencies stemming from distorted or misaligned elements. Thus, feature line detection is paramount in preparing surfaces for mesh generation.

This guide outlines classifications of feature lines, their geometric basis, principal detection methodologies, and their influence on meshing workflows. It serves CAE professionals and software developers seeking a concise yet thorough understanding of feature lines and their role in robust preprocessing and mesh creation.
Download PDF 
feature_lines

What Feature Lines Are

Feature lines refer to curves on a surface that help reveal and explain its geometric form. These lines denote changes—either abrupt or gradual—in the behavior of the surface and are significant to overall form. In practice, feature lines indicate to meshing algorithms which areas require careful attention to geometric details.

For CAE engineers, feature lines indicate optimal locations for element orientation, necessary refinement, and appropriate segmentation. For software engineers, these geometric markers inform preprocessing routines, curvature analysis, and feature-aware mesh generation.

Feature lines typically arise from two main geometric phenomena:

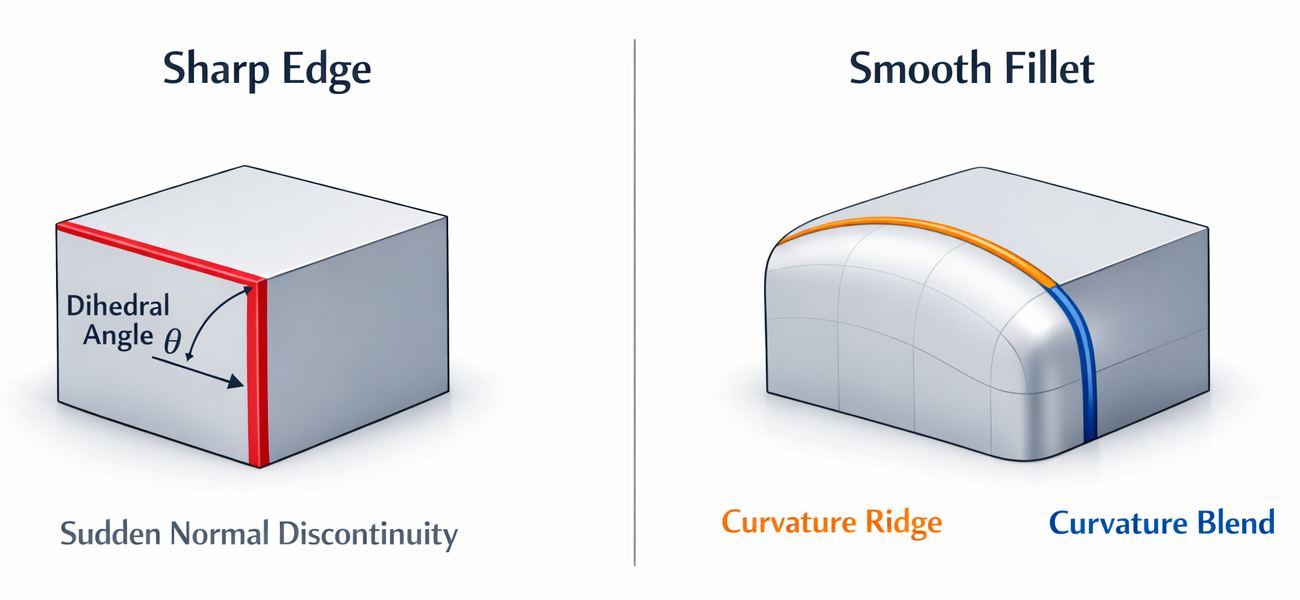
  • Discontinuities in surface orientation: exemplified by sharp edges that exhibit sudden shifts in surface normal direction.
  • Extrema or rapid variations in curvature: including ridges, valleys, and blends observable even on smooth CAD surfaces.

These characteristics produce curves that are both visually distinct and geometrically consequential, supplying critical structural information beyond what standard triangles or NURBS patches convey.

Feature lines serve three primary functions:

  • Clarifying shape through emphasis on transitions, bends, and functional elements.
  • Dividing the surface into regions conducive to consistent meshing.
  • Informing downstream processes, such as segmentation, refinement, boundary layer formation, and solver stabilization.

Feature lines connect geometry and mesh, making surfaces clear and ready for quality meshing.

Types of Feature Lines and Their Surface Origins

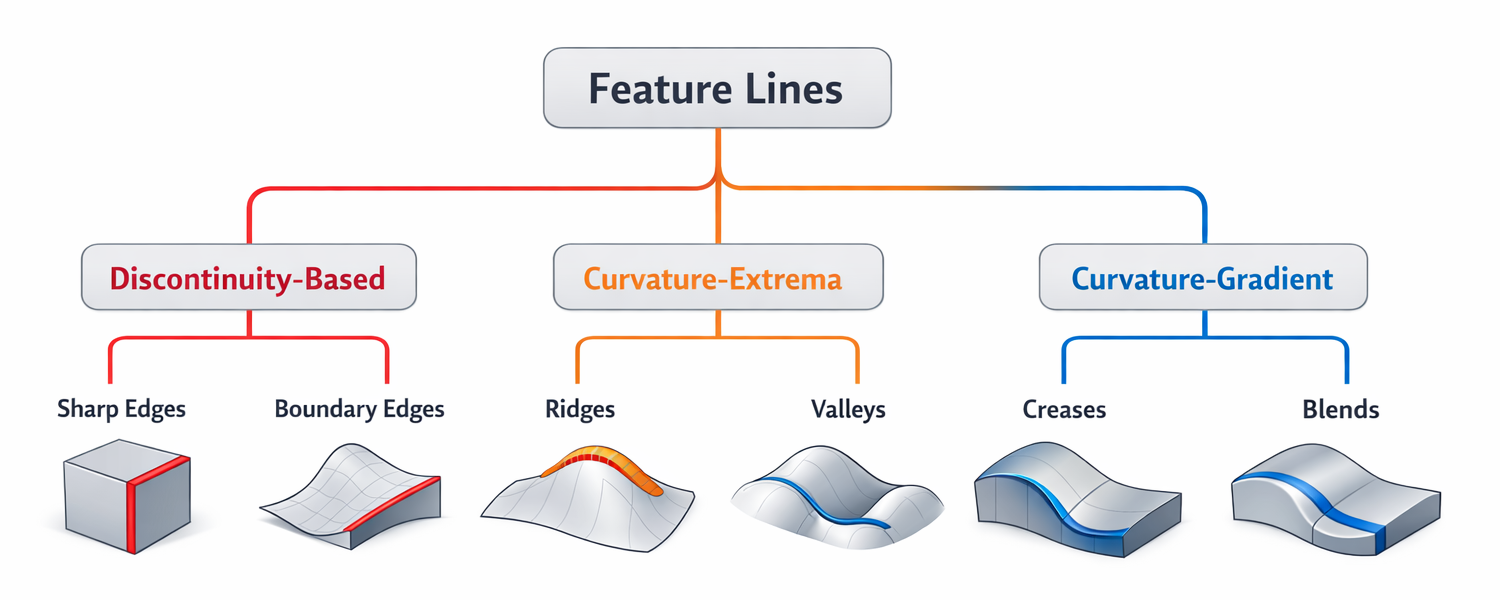
Feature lines possess unique geometric attributes and can be recognized through a well-defined classification system, which is advantageous for both engineering and software development. Each category reflects a surface signal: either an abrupt change in orientation or a noteworthy curvature pattern.

taxonomy

Discontinuity-Based Feature Lines

These emerge where the surface’s orientation shifts abruptly, making them highly visible and straightforward to identify.

Sharp Edges — Sudden Normal Discontinuities

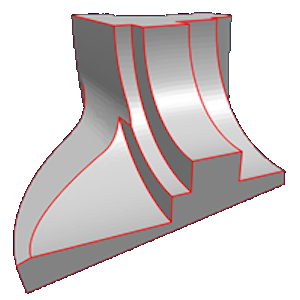
Sharp edges arise when the dihedral angle between adjoining surface regions exceeds a threshold, indicating marked normal discontinuity. Such edges define boundaries, corners, and engineered transitions.

sharp_n_smooth
Boundary Edges — Surface Terminations

Boundary edges occur at open ends of the surface. Although not representative of curvature features, they are crucial for segmentation, imposition of meshing constraints, and formation of boundary layers. These are prevalent in CAD models and manufactured components, reflecting explicit design intent.

Curvature-Extrema Feature Lines

Present on smooth surfaces, these lines trace regions where curvature reaches local maxima or minima along primary directions.

Ridges — Maxima of Principal Curvature

Ridges appear when one principal curvature reaches a peak along its axis, highlighting areas of convex shape and important contours.

curvsture_extrema
Valleys — Minima of Principal Curvature

Valleys are local minima in principal curvature, marking concave channels and grooves that guide fluids.

Even on perfectly smooth NURBS surfaces, these features reveal dynamic shaping beyond mere sharp edges.

Curvature-Gradient Feature Lines

Derived from transitions in curvature rather than its magnitude, these lines capture nuanced surface changes.

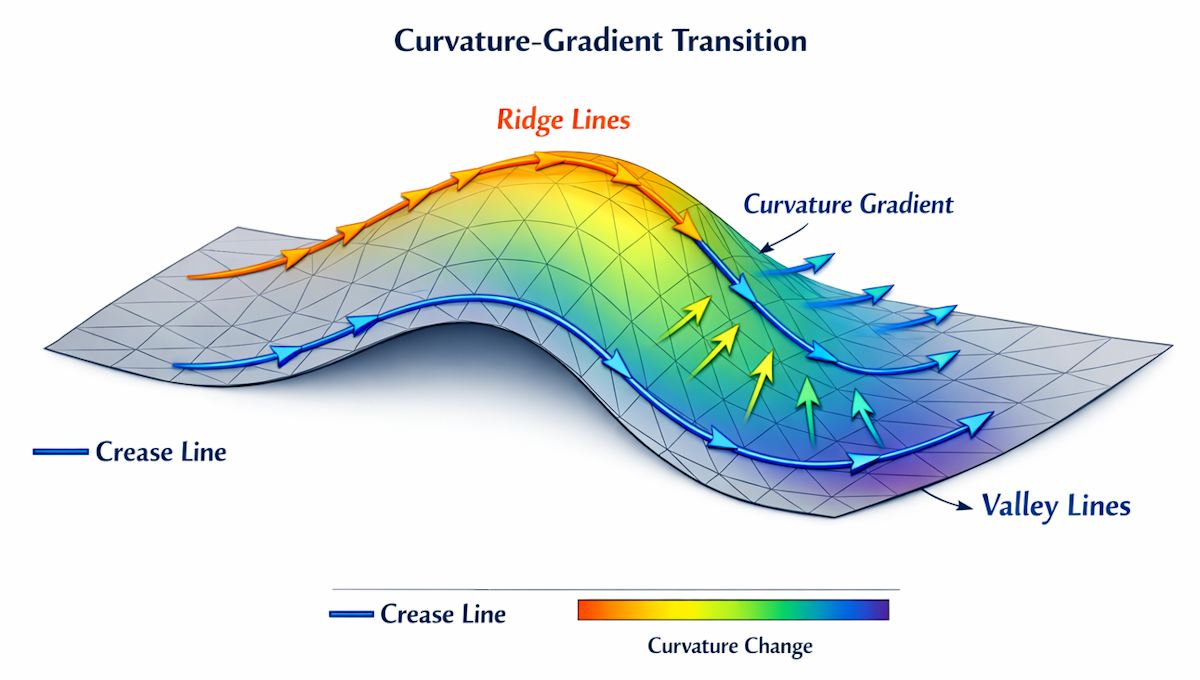
Creases — Rapid Continuous Curvature Changes

Creases identify surface areas of rapid but uninterrupted curvature variation, influencing mesh quality while preserving surface continuity.

curvature_gradient
Blend Transitions — Fillets and Chamfers

Blends appear where two surfaces meet via a transition region characterized by substantial curvature variation, informing segmentation and refinement strategies. These are common in CAD environments where fillets promote manufacturability and stress distribution.

Importance of Taxonomy

Classifying feature lines according to their geometric origin guides the selection of detection techniques:

  • Discontinuity-based detection uses normal jumps.
  • Curvature-extrema relies on principal curvature computation.
  • Curvature-gradient depends on curvature derivatives and advanced differential geometry methods.

This taxonomy clarifies each feature type’s influence on mesh generation: sharp edges dictate alignment, ridges and valleys drive refinement, and blends facilitate segmentation boundaries.

The Geometry Behind Feature Lines

Feature lines result from precise geometric signals that govern bending, twisting, and connectivity on surfaces. Mastery of these signals is vital for both engineering analysis and algorithm development. Three core geometric constructs underpin feature line detection: surface normals, principal curvatures, and curvature derivatives.

Orientation Changes and Surface Normals

Surface normals describe local orientation. The convergence of neighboring patches is evaluated by measuring the angle between their normal vectors.

  • Minimal differences suggest smooth connections.
  • Significant differences indicate sharp boundaries.

The dihedral angle between normals is a key measure; exceeding a given threshold identifies edges as discontinuity-based features. This method ensures effective sharp-edge detection, especially within triangular mesh contexts.

Curvature and Principal Directions

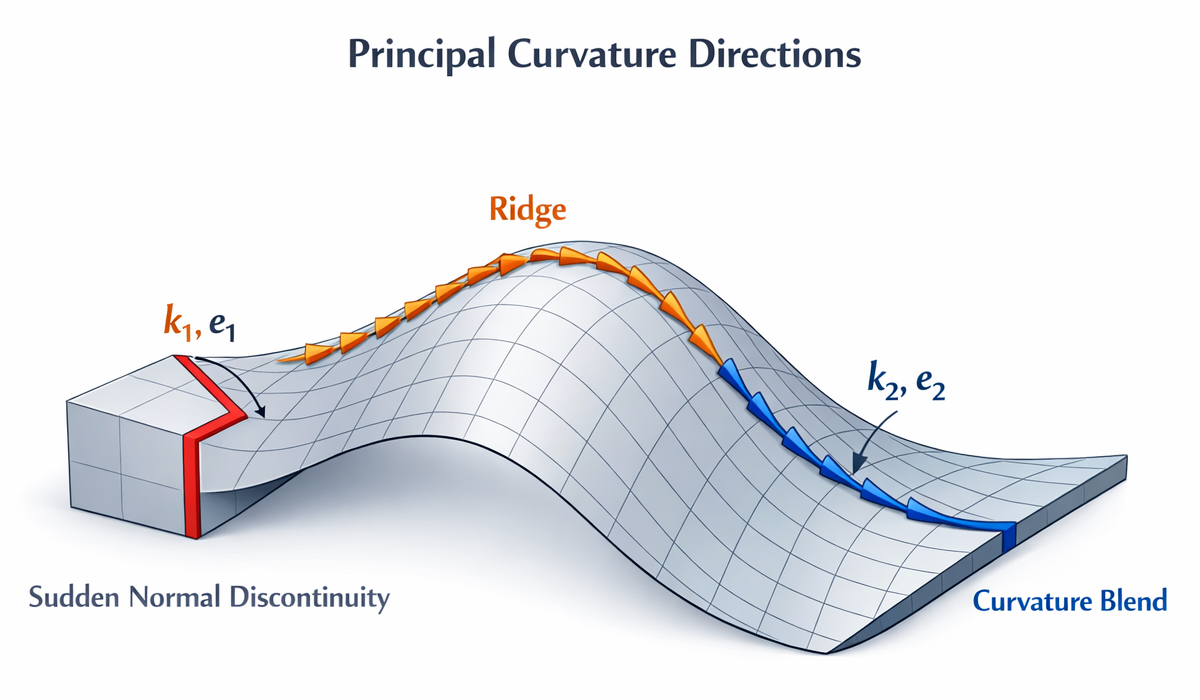
Curvature quantifies surface bending. Each point on a continuous surface has two principal curvatures:

  • \(k_1\) : Maximum curvature
  • \(k_2\) : Minimum curvature

Principal directions and define the axes of bending. Ridges and valleys derive from unique curvature patterns:

  • Ridges occur where \(k_1\) attains a local maximum along \(e_1\).
  • Valleys occur where \(k_1\) reaches a local minimum along \(e_1\).

Such features surface even on immaculate CAD models, revealing characteristics that supplement sharp-edge analysis.

Visualizing Principal Directions

Curvature Derivatives and Rapid Transitions

Certain feature lines stem from curvature variability across the surface, characterized by curvature derivatives—rates of change in \(k_1\) or \(k_2\).

  • Creases manifest where curvature shifts rapidly yet smoothly.
  • Blend transitions occur in areas with significant changes in curvature, particularly within fillet or chamfer zones.

Mathematically, these correspond to peaks or zero-crossings in directional curvature derivatives. Detection involves sophisticated differential geometry tools, such as the shape operator or Weingarten map, integral to segmentation and meshing.

Significance of Geometric Signals

Normals, curvatures, and their derivatives establish a hierarchy of geometric descriptors:

  • Normals detect abrupt changes.
  • Curvatures highlight significant smooth features.
  • Curvature derivatives discern subtle transitions and blends.

This classification justifies diverse detection approaches and underscores the advantages of hybrid methodologies for enhancing reliability in practical CAE applications.

Feature Line Detection Methodologies

Feature line detection transforms geometric signals—including normal discontinuities, curvature distributions, and derivatives of curvature—into tangible curves delineated on surfaces. Different methodologies aim to identify distinct feature types, each offering unique advantages, limitations, and ideal uses. For professionals engaged in CAE engineering or meshing software development, it is essential to understand both the operational fundamentals of these methods and their appropriate contexts within meshing workflows.

Normal-Based Detection

Normal-based approaches determine feature lines by assessing dihedral angles between adjacent surface element normals. When the angle goes beyond a certain threshold, the edge is identified as a unique sharp feature.

Strengths
  • Simple and computationally efficient, making it suitable for large meshes.
  • Directly operates on triangle meshes, eliminating the need for curvature estimation.
  • Particularly effective for CAD models with explicit edges and manufactured geometries.
Limitations
  • Cannot detect smooth features such as ridges, valleys, and blended surfaces.
  • The accuracy of results depends on the mesh quality, as triangles with poor shapes may lead to errors in normal calculations.
Optimal Applications
  • Industrial CAD components.
  • Models with deliberate sharp edges.
  • Preprocessing environments prioritizing computational efficiency.

Normal-based detection frequently serves as the initial stage in hybrid workflows, efficiently capturing prominent features with minimal computational cost.

Curvature-Based Detection

Curvature-driven techniques utilize principal curvatures and their directions to locate ridges, valleys, and other smoothly varying features. These methods depend upon the estimation of curvature tensors or the shape operator.

Strengths
  • Detects subtle yet crucial features missed by normal-based algorithms.
  • Enables identification of aerodynamic profiles, fillets, and organic transitions within functional geometry.
Limitations
  • Accurate curvature estimation is important; however, noise in raw meshes can influence the results.
  • Sensitive to irregularities and noisy data.
  • Computational demand exceeds that of normal-based methods.
Optimal Applications
  • Smooth CAD surfaces.
  • Scanned or organically modeled geometries.
  • Scenarios demanding detailed analysis of curvature behavior (e.g., fluid dynamics, structural transitions).

Curvature-based detection is indispensable for comprehensive surface analysis extending beyond explicitly defined edges.

Differential Geometry Operator Methods

Advanced methods employ geometric operators, including the shape operator, Weingarten map, and curvature derivatives, to pinpoint regions where curvature changes rapidly or reaches extrema.

Strengths
  • Delivers highly accurate representations of theoretical ridge and valley definitions.
  • Captures creases, blends, and curvature-gradient features with exceptional precision.
  • Produces mathematically rigorous feature curves.
Limitations
  • Computational requirements are high.
  • Superior curvature estimation and smoothing routines are mandatory.
  • Implementation and parameter calibration are complex.
Optimal Applications
  • High-precision meshing processes.
  • Research-grade and advanced industrial use cases.
  • Scenarios require dependable identification of blends and nuanced transitions.

These techniques underpin sophisticated feature detection algorithms within contemporary meshing software.

Graph-Based Detection

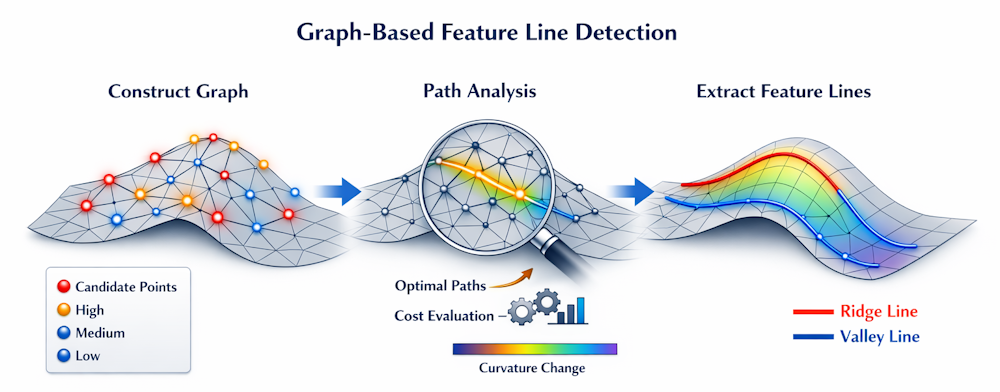
Graph-oriented strategies interpret the mesh as a graph structure, identifying feature lines as routes of heightened geometric cost, which may derive from curvature, normal variation, or alternative local metrics.

Strengths
  • Maintains robustness against noise when combined with smoothing techniques.
  • Seamlessly supports segmentation and region-growth workflows.
  • Ensures connectivity and continuity of detected feature lines.
Limitations
  • Cost function design requires careful attention.
  • Susceptible to false positives when curvature fields exhibit noise.
  • Abstract and less directly tied to conventional geometric theory.
Optimal Applications
  • Segmentation processing pipelines.
  • Meshes characterized by substantial noise or incompleteness.
  • Contexts necessitating continuous and topologically coherent feature lines.

Graph-based detection is particularly effective for tasks combining feature identification and surface organization.

Graph-Based Detection

Hybrid Detection

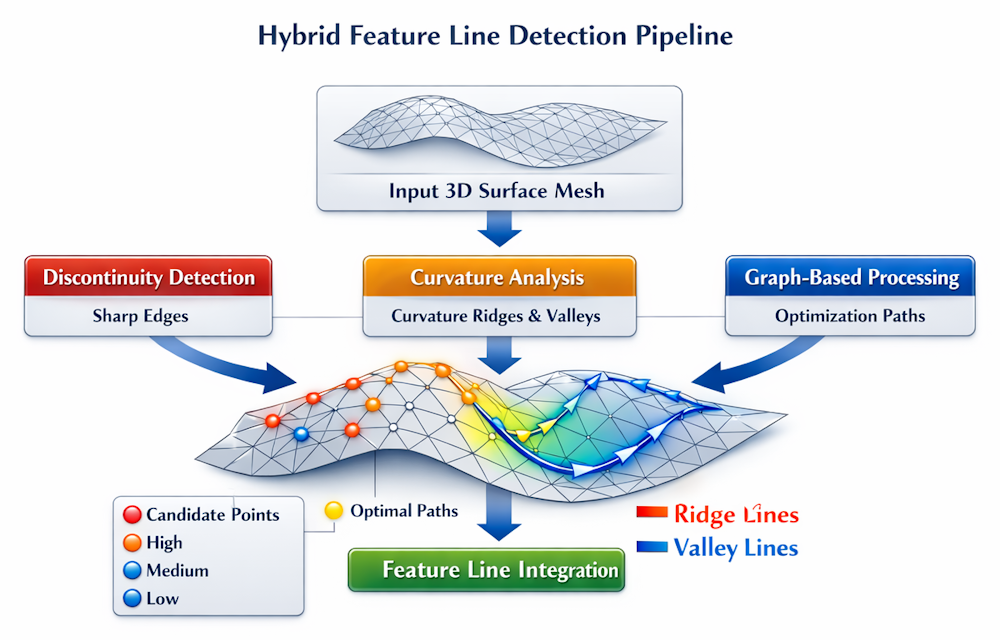
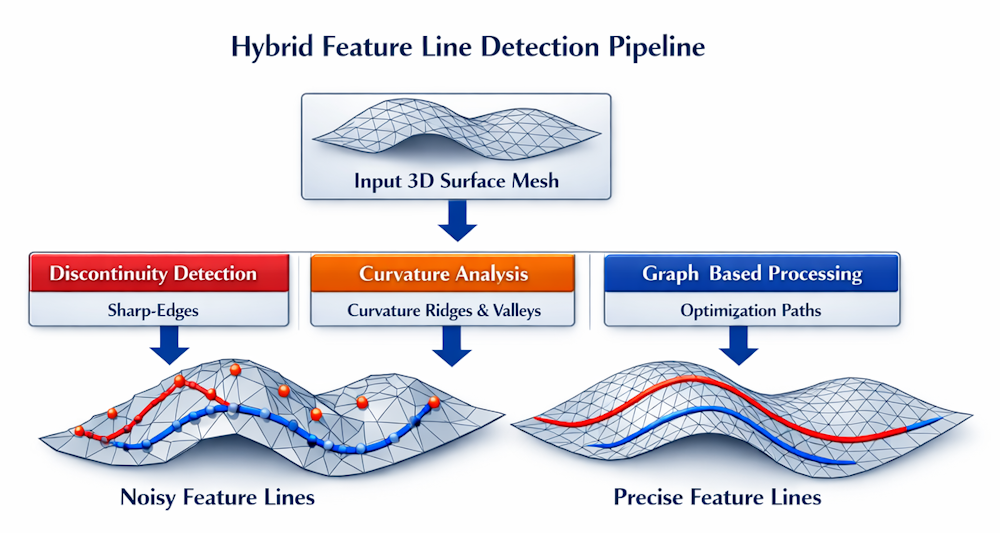
Hybrid techniques integrate normal discontinuity, curvature extrema, and curvature-gradient information, delivering robust feature lines across varied geometric configurations.

Strengths
  • Provides high reliability for practical CAE workflows.
  • Accommodates CAD, scanned meshes, and organic shapes within an integrated framework.
  • Minimizes false positives via multi-signal validation.
Limitations
  • Threshold and weight calibration among signals adds complexity.
  • More intricate implementation compared to single-signal approaches.
Optimal Applications
  • Industrial preprocessing operations.
  • Meshes with varying quality and diverse origins.
  • Automated meshing workflows require enhanced robustness.

Hybrid detection represents best practice in modern meshing tools, combining expedient normal-based detection with refined curvature analysis to exhaustively identify both sharp and smooth features.

Hybrid Detection

Feature Line Visualization

Effective visualization of feature lines is fundamental for interpreting geometric properties and validating detection algorithms. Translating abstract attributes—such as normals, curvatures, and derivatives—into actionable insights enables engineers to analyze and developers to debug workflows. Quality visual representations facilitate evaluation of detection accuracy, stability of curvature fields, and alignment of segmentation with design intent.

Edge Highlighting and Overlays

A straightforward visualization protocol overlays detected feature lines atop the mesh or surface. Typically, neutral, or cool-toned meshes (gray, cyan, or light blue) serve as backgrounds, with feature lines rendered in contrasting warm colors like orange or red. This enhances visibility of sharp edges, ridges, and valleys, and assists in identifying gaps, broken segments, or erroneous detections.

Curvature Heatmaps

Curvature heatmaps visually communicate surface bending by mapping principal curvature, mean curvature, or Gaussian curvature magnitudes to color gradients. Overlaying feature lines on heatmaps elucidates relationships among ridges, valleys, and curvature extrema, particularly beneficial for examining smooth CAD or organic surfaces.

Curvature Heatmap

Ridge and Valley Mapping

Ridge and valley maps selectively emphasize regions exhibiting local maxima or minima in principal curvature, isolating curvature-extrema features. These maps differentiate genuine geometric features from noise and demonstrate estimation stability—critical considerations for curvature-based detection.

Segmentation and Region Boundaries

Feature lines often correspond to surface patch boundaries. Visualizing segmentation through color-coded regions or boundary overlays illustrates surface partitioning according to detected features, supporting meshing constraints, patch generation, and boundary layer definition.

Visualization’s Role in Detection and Meshing

Visualization functions as both presentation and diagnostic tool. It empowers engineers to confirm feature correspondence with actual geometry and provides developers feedback for optimizing thresholds, smoothing parameters, and curvature estimators. Moreover, it reveals the influence of feature lines on subsequent meshing steps, such as element alignment and refinement strategies.

Feature Lines in Meshing and Solver Stability

Feature lines are pivotal in surface and volume meshing processes. They guide element alignment, refinement placement, boundary layer formation, and impact solver stability. For CAE engineers, feature lines inform meshing workflows, while for software developers, they function as crucial constraints for algorithmic design.

Element Alignment and Mesh Directionality

Optimal mesh performance is achieved when elements align with the inherent geometric structure. Feature lines provide this framework; aligning elements with sharp edges, ridges, and valleys ensures minimal distortion and consistent orientation. This alignment reduces skewness and enhances mesh conditioning, whereas disregarding feature lines leads to distorted elements and diminished solver accuracy.

Element Alignment

Refinement Placement and Local Resolution

Feature lines signal areas for local mesh refinement. Sharp edges demand finer elements to resolve discontinuities, and regions of pronounced curvature require increased resolution. By refining targets, resources are allocated more efficiently, achieving greater accuracy while controlling computational expenses.

Surface Segmentation and Patch Definition

Feature lines facilitate division of surfaces into distinct regions, informing meshing constraints, element sizing, and boundary layer placement. Effective segmentation reduces tangled elements and promotes consistent element flow, establishing a foundation for automated workflows.

Boundary Layer Construction and Wall-Aligned Meshing

In CFD and thermal simulations, boundary layers must adhere closely to the geometry. Feature lines dictate alignment along sharp edges and directional changes, promoting continuity and preventing invalid element formation.

Solver Stability and Numerical Conditioning

Failure to accurately capture features results in distorted elements, unfavorable aspect ratios, and inverted Jacobians, undermining solver reliability. Feature-aware meshing mitigates such risks by ensuring fidelity to geometry, enhancing element quality and simulation robustness.

Influence Across Meshing Workflows

Beyond mesh structure, feature lines inform preprocessing procedures including smoothing, curvature estimation, segmentation, and refinement. They enable early detection of problematic regions, reducing manual intervention and fostering robust, automated, efficient workflows.

Conclusion

Feature lines elevate surface models from simple assemblies of triangles or NURBS patches to coherent, interpretable structures. They expose underlying geometric frameworks—highlighting areas of curvature, transition, and boundary significance. For CAE engineers, feature lines are essential guides for element alignment, refinement, segmentation, and boundary layering. These features serve as critical indicators that developers must consistently recognize, preserve, and use to produce high-quality mesh generation.

By marking discontinuities, curvature extrema, and gradient transitions, feature lines clarify geometry in ways not achievable raw surfaces alone. Reliable detection methods—including normal jumps, curvature analysis, differential-geometric operators, graph-based algorithms, and hybrid strategies—establish robust preprocessing foundations. Effective visualization allows both engineers and developers to validate geometry, troubleshoot detection, and assess the impact on subsequent analytic stages.

As simulation demands and model complexity escalate, feature-aware meshing becomes fundamental. Feature lines define structural benchmarks for meshes and offer crucial insights for engineers. They bridge the gap between geometric definition and analytical evaluation, supporting improved segmentation, enhanced element quality, and greater solver stability. In modern CAE applications, feature lines are indispensable, underpinning reliable and accurate advanced meshing solutions.